As I’ve noted in a previous post, I am logging moisture and temperature data to an SD card. I wrote a small Python script to plot the data as time series. An example is shown in Figure 1.
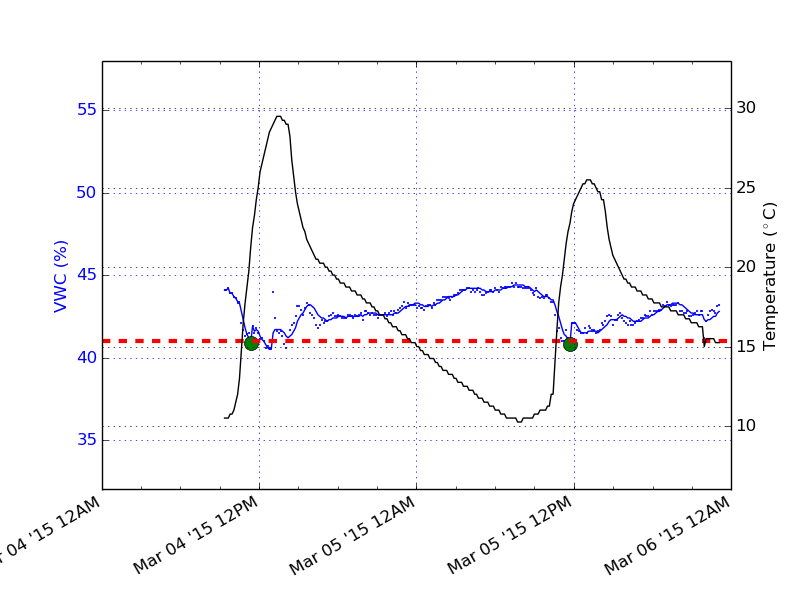
Figure 1: Data Log, Planter Box #1
The foregoing figure shows the Volumetric Water Content (VWC) of the soil in blue, and the soil temperature in black. The broken red line shows a threshold VWC value for soil, below which the soil is considered dry enough to open the valve and start the water supply. The threshold value was obtained through hit-and-trial, since it can depend on how tightly the soil is packed and how much of the soil the VG400 is actually in contact with. Too low a value and the soil can get extremely dry. Too high and water will start draining out (and possibly cause root damage). The green circles show the instances when the solenoid valves were opened in order to allow water to flow to the soil.
Sensor Noise
The DS18B20 temperature sensor provides a resolution of 0.25°C. Any variation of that order of magnitude is low enough to not concern me, so I just use the raw temperature sensor reading. The moisture reading, however, can vary by up to 2%, and I used a rather simple Kalman filter to obtain an estimated VWC. In Figure 1, the measured VWC is depicted by the blue dots.
Temperature and Moisture Measurement Correlation
I’ve mentioned before that I wasn’t entirely satisfied with the VG400 sensor since the moisture reading seemed to depend on the temperature. The soil can get pretty warm (Figure 1): in the afternoon the box in direct sunlight can register a temperature up to 8°C higher than the ambient. Also, note how quickly the soil temperature rises, but the relative slower rate at which it decreases. At higher temperatures, I’ve observed that the moisture reading can be lower than usual, and this can cause the solenoid valve to open even the soil doesn’t need the water. I plotted the VWC vs. soil temperature for one day’s worth of data, this is shown in Figure 2.
A key assumption is that the rate of moisture loss over a single day can be ignored, although I can estimate this using the Kalman filter described in the previous section. The correlation coefficient of the data is -0.84, and the magnitude is very high. Obviously some sort of calibration is needed. For now, I’ve just instructed the controller to ignore any requests for opening the valve if the temperature is greater than 25°C.

Figure 2: Variation of Soil Moisture with Soil Temperature
Greenhouse
If you’re wondering why the maximum temperature recorded on March 4 and March 5 are different (Figure 1), it’s because I’m trying to build a greenhouse for the planter boxes. I say ‘trying’ because the ones that I’ve made so far are ugly, and I’m not pursuing them seriously since it’s spring and I won’t need to keep things warm for several months. My preliminary design appears to be warming the soil up well, but it doesn’t appear to be retaining warmth at night. In order to account for day-to-day temperature variations, I plotted the temperature difference between boxes #1 and #2, in Figure 3.

Figure 3: Temperature Difference Variation between Boxes #1 and #2 with Time
I’ve noted that the temperature in Box #1 is always higher than that of Box #2, because of the angle of the sunlight on my porch (similarly, the temperature of Box #2 is higher than that of Box #3, etc.). It’s a reasonable assumption that this difference is constant in the day time, within the same week. A difference of up to 10°C is noted on the day when Box #1 was enclosed in the greenhouse (March 4), and the maximum difference on the following day (March 5), when no greenhouse was used, is 6°C. I conclude that the greenhouse can raise the soil temperature by about 4°C in the day and about 2°C at night. Proper insulation will perhaps reduce the rate of heat loss, and I hope to have an update on that in the future.
